815 views
やりたいこと
PyTorchを使って、最もシンプルな実装例 を作りたい。
選んだテーマは
y = sin(x)
入力 x に対して、出力 y = sin(x) を学習するモデルを作ってみる。
やってみる
1) シンプル実装
| 入力値 x | -4π ~ 4π の範囲で等間隔に 1000点のデータを作成 |
| ・ x(訓練用) | xの中で、配列インデックスが偶数番目の要素を抽出 |
| ・ x(テスト用) | xの中で、配列インデックスが奇数番目の要素を抽出 |
Neural Networkの構成 :
[入力:1] – [隠れ:64] – [隠れ:64] – [出力:1]
※[]内の数値は層内のニューロン数
画像作成 :
1000epochs完了時にテスト用データを使って予測値を算出し、グラフ表示する。

import torch
import torch.nn as nn
import torch.optim as optim
import numpy as np
import matplotlib.pyplot as plt

#-------------------------------------------------------------------------------
# ニューラルネット定義
class SineApproximator(nn.Module):
    def __init__(self):
        super().__init__()
        self.model = nn.Sequential(
            nn.Linear( 1, 64), nn.Tanh(),
            nn.Linear(64, 64), nn.Tanh(),
            nn.Linear(64,  1)
        )
    def forward(self, x):
        return self.model(x)

#-------------------------------------------------------------------------------
# データ作成
x_all = np.linspace(-4 * np.pi, 4 * np.pi, 1000)    # -2π~2πの範囲で等間隔に 1000個の点
y_all = np.sin(x_all)                               # y=sin(x)
# 偶数番目 → 訓練用        [start:stop:step]
x_train = x_all[::2]        # [先頭:終端:2step]
y_train = y_all[::2]        # [先頭:終端:2step]
# 奇数番目 → テスト用
x_test = x_all[1::2]        # [先頭+1:終端:2step]
y_test = y_all[1::2]        # [先頭+1:終端:2step]
# Tensor化
x_tensor          = torch.tensor(x_train, dtype=torch.float32).unsqueeze(1)     # 入力データ(train用)
y_tensor          = torch.tensor(y_train, dtype=torch.float32).unsqueeze(1)     # 正解データ(train用)
x_tensor_for_test = torch.tensor(x_test,  dtype=torch.float32).unsqueeze(1)     # 入力データ(test用)

#-------------------------------------------------------------------------------
# モデル・インスタンスを生成
model = SineApproximator()
criterion = nn.MSELoss()                                # 損失関数:   MSE
optimizer = optim.Adam(model.parameters(), lr=0.01)     # 勾配降下法: Adam

#-------------------------------------------------------------------------------
# 学習ループ
for epoch in range(1000):
    model.train()
    optimizer.zero_grad()
    outputs = model(x_tensor)
    loss = criterion(outputs, y_tensor)
    loss.backward()
    optimizer.step()
    if epoch % 100 == 0:
        print(f"Epoch {epoch}, Loss: {loss.item():.6f}")

#-------------------------------------------------------------------------------
# 結果の可視化(テストデータで評価)
model.eval()
with torch.no_grad():
    y_pred_test = model(x_tensor_for_test).numpy()
# グラフ表示
plt.plot(x_test, y_test,      label="True sin(x) [Test]", color='blue')
plt.plot(x_test, y_pred_test, label="Predicted [Test]",   color='red', linestyle='dashed')
plt.title("Sine Approximation: Test on Unused Indices")
plt.xlabel("x")
plt.ylabel("sin(x)")
plt.grid(True)
plt.legend()
plt.show()
もし matplotlibでグラフが表示されない場合は?
matplotlibの設定ファイルを見直す。
Python仮想環境のディレクトリ配下で matplotlibの設定ファイルを探す。
$ find . -name "matplotlibrc"
検出したファイル matplotlibrc を開き backend指定を書き換える。
$ vi matplotlibrc
#backend     : agg
backend      : tkagg
もし必要なら、python3-tkをインストールする。
$ sudo apt install python3-tk
これで再度実行してみる。
グラフが表示されるはず・・・
(2) アニメーション実装
モデルの学習でやっていることは、前記のシンプル実装とまったく同じ。
変更点:
10epochsに一度テストデータを入力して推論を実行し、その出力値でグラフを作成する。
全 1000 epochs終了時に、グラフを連結してアニメーションGIF画像を作る。
import torch
import torch.nn as nn
import torch.optim as optim
import numpy as np
import matplotlib.pyplot as plt
import io
from PIL import Image
#-------------------------------------------------------------------------------
# プロット画像をPIL形式で生成
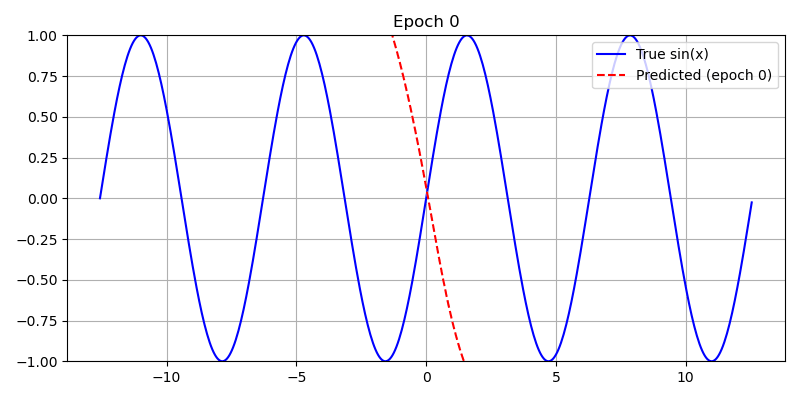
def create_plot_image(x_train, y_true, x_test, y_pred, epoch):
plt.figure(figsize=(8, 4))
plt.plot(x_train, y_true, label="True sin(x)", color="blue")
plt.plot(x_test, y_pred, label=f"Predicted (epoch {epoch})", color="red", linestyle="dashed")
plt.title(f"Epoch {epoch}")
plt.ylim(-1.0, 1.0) # Y軸スケールを固定
plt.legend(loc='upper right')
plt.grid(True)
plt.tight_layout()
buf = io.BytesIO()
plt.savefig(buf, format="png")
buf.seek(0)
img = Image.open(buf).convert("RGB")
plt.close()
return img
#-------------------------------------------------------------------------------
# ニューラルネット定義
class SineApproximator(nn.Module):
def __init__(self):
super().__init__()
self.model = nn.Sequential(
nn.Linear( 1, 64), nn.Tanh(),
nn.Linear(64, 64), nn.Tanh(),
nn.Linear(64, 1)
)
def forward(self, x):
return self.model(x)
#-------------------------------------------------------------------------------
# データ作成
x_all = np.linspace(-4 * np.pi, 4 * np.pi, 1000) # -2π~2πの範囲で等間隔に 1000個の点
y_all = np.sin(x_all) # y=sin(x)
# 偶数番目 → 訓練用 [start:stop:step]
x_train = x_all[::2] # [先頭:終端:2step]
y_train = y_all[::2] # [先頭:終端:2step]
# 奇数番目 → テスト用
x_test = x_all[1::2] # [先頭+1:終端:2step]
y_test = y_all[1::2] # [先頭+1:終端:2step]
# Tensor化
x_tensor_train = torch.tensor(x_train, dtype=torch.float32).unsqueeze(1) # 入力データ(train用)
y_tensor_train = torch.tensor(y_train, dtype=torch.float32).unsqueeze(1) # 正解データ(train用)
x_tensor_test = torch.tensor(x_test, dtype=torch.float32).unsqueeze(1) # 入力データ(test用)
#-------------------------------------------------------------------------------
# モデル・インスタンスを生成
model = SineApproximator()
criterion = nn.MSELoss() # 損失関数: MSE
optimizer = optim.Adam(model.parameters(), lr=0.01) # 勾配降下法: Adam
images = [] # GIF画像データ保存リスト
#-------------------------------------------------------------------------------
# 学習ループ
for epoch in range(1000):
model.train()
optimizer.zero_grad()
outputs = model(x_tensor_train) # 順伝播
loss = criterion(outputs, y_tensor_train) # 誤差算出
loss.backward() # 逆伝播
optimizer.step() # パラメータ更新
# 画像生成
if epoch % 10 == 0:
model.eval()
with torch.no_grad():
y_pred = model(x_tensor_test).numpy() # 推論
img = create_plot_image(x_train, y_train, x_test, y_pred, epoch)
images.append(img)
# 経過表示
if epoch % 100 == 0:
print(f"Epoch {epoch}, Loss: {loss.item():.6f}")
#-------------------------------------------------------------------------------
# GIF出力
gif_path = "sine_training.gif"
images[0].save(gif_path, save_all=True, append_images=images[1:], duration=100, loop=0)
print(f"GIF saved as: {gif_path}")
アクセス数(直近7日): ※試験運用中、BOT除外簡易実装済2026-06-19: 1回 2026-06-18: 1回 2026-06-17: 0回 2026-06-16: 0回 2026-06-15: 0回 2026-06-14: 1回 2026-06-13: 0回